[사전학습] 2.5 시계열 기초
시계열 데이터 기초
pd.to_datetime
1
2
import numpy as np
import pandas as pd
1
2
3
4
date = ["2020/01/01", "2020/02/01", "2020/03/01", "2020/04/01"]
date_idx = pd.to_datetime(date)

print(date_idx)
1
DatetimeIndex(['2020-01-01', '2020-02-01', '2020-03-01', '2020-04-01'], dtype='datetime64[ns]', freq=None)
1
2
3
4
np.random.seed(1)

random_int = np.random.randint(3, 10, size=4)
random_int
1
array([8, 6, 7, 3])
1
2
series = pd.Series(random_int, index=date_idx)
series
1
2
3
4
5
2020-01-01    8
2020-02-01    6
2020-03-01    7
2020-04-01    3
dtype: int32
date 문자열이 yyyy/mm/dd의 형식이 아니라도 대부분의 경우에서 to_datetime 함수를 사용 할 수 있다.
예제 1) 마침표로 구분된 날짜
1
2
3
4
date = ["2020.01.01", "2020.02.01", "2020.03.01", "2020.04.01"]
date_idx2 = pd.to_datetime(date)

print(date_idx2)
1
DatetimeIndex(['2020-01-01', '2020-02-01', '2020-03-01', '2020-04-01'], dtype='datetime64[ns]', freq=None)
예제 2) 콤마로 구분된 날짜
1
2
3
4
date = ["2020,01,01", "2020,02,01", "2020,03,01", "2020,04,01"]
date_idx3 = pd.to_datetime(date)

print(date_idx3)
1
DatetimeIndex(['2020-01-01', '2020-01-01', '2020-01-01', '2020-01-01'], dtype='datetime64[ns]', freq=None)
예제 3) 띄어쓰기로 구분된 날짜
1
2
3
4
date = ["2020 01 01", "2020 02 01", "2020 03 01", "2020 04 01"]
date_idx4 = pd.to_datetime(date)

print(date_idx4)
1
DatetimeIndex(['2020-01-01', '2020-02-01', '2020-03-01', '2020-04-01'], dtype='datetime64[ns]', freq=None)
pd.date_range
1
pd.date_range('2020-1-1', '2020-05-31')
1
2
3
4
5
6
7
8
DatetimeIndex(['2020-01-01', '2020-01-02', '2020-01-03', '2020-01-04',
               '2020-01-05', '2020-01-06', '2020-01-07', '2020-01-08',
               '2020-01-09', '2020-01-10',
               ...
               '2020-05-22', '2020-05-23', '2020-05-24', '2020-05-25',
               '2020-05-26', '2020-05-27', '2020-05-28', '2020-05-29',
               '2020-05-30', '2020-05-31'],
              dtype='datetime64[ns]', length=152, freq='D')
1
pd.date_range('2020-1-1', '2020-05-31', freq='M') # freq = 'M' : 월별 데이터로 생성 인수 (각 월말일 기준)
1
2
3
DatetimeIndex(['2020-01-31', '2020-02-29', '2020-03-31', '2020-04-30',
               '2020-05-31'],
              dtype='datetime64[ns]', freq='M')
1
pd.date_range('2020-1-1', '2020-05-31', freq='MS') # freq = 'MS' : 월별 각 첫일로 데이터 생성
1
2
3
DatetimeIndex(['2020-01-01', '2020-02-01', '2020-03-01', '2020-04-01',
               '2020-05-01'],
              dtype='datetime64[ns]', freq='MS')
freq 인수에 관한 자세한 설명은 공식 레퍼런스를 참조. 아래는 많이 사용하는 인수를 간추려 놓은 리스트이다.
D: 일별 (default 값)W: 주별 (일요일 기준)W-MON: 주별 (월요일 기준)M: 월별 (월의 마지막 날)MS: 월별 (월의 첫째 날)B: 주말을 제외한 평일 인덱스 (i.e. 토, 일 제외)
1
pd.date_range(start='2020-1-1', periods=45)
1
2
3
4
5
6
7
8
9
10
11
12
13
DatetimeIndex(['2020-01-01', '2020-01-02', '2020-01-03', '2020-01-04',
               '2020-01-05', '2020-01-06', '2020-01-07', '2020-01-08',
               '2020-01-09', '2020-01-10', '2020-01-11', '2020-01-12',
               '2020-01-13', '2020-01-14', '2020-01-15', '2020-01-16',
               '2020-01-17', '2020-01-18', '2020-01-19', '2020-01-20',
               '2020-01-21', '2020-01-22', '2020-01-23', '2020-01-24',
               '2020-01-25', '2020-01-26', '2020-01-27', '2020-01-28',
               '2020-01-29', '2020-01-30', '2020-01-31', '2020-02-01',
               '2020-02-02', '2020-02-03', '2020-02-04', '2020-02-05',
               '2020-02-06', '2020-02-07', '2020-02-08', '2020-02-09',
               '2020-02-10', '2020-02-11', '2020-02-12', '2020-02-13',
               '2020-02-14'],
              dtype='datetime64[ns]', freq='D')
1
pd.date_range(start='2020-1-1', periods=45, freq='MS')
1
2
3
4
5
6
7
8
9
10
11
12
13
DatetimeIndex(['2020-01-01', '2020-02-01', '2020-03-01', '2020-04-01',
               '2020-05-01', '2020-06-01', '2020-07-01', '2020-08-01',
               '2020-09-01', '2020-10-01', '2020-11-01', '2020-12-01',
               '2021-01-01', '2021-02-01', '2021-03-01', '2021-04-01',
               '2021-05-01', '2021-06-01', '2021-07-01', '2021-08-01',
               '2021-09-01', '2021-10-01', '2021-11-01', '2021-12-01',
               '2022-01-01', '2022-02-01', '2022-03-01', '2022-04-01',
               '2022-05-01', '2022-06-01', '2022-07-01', '2022-08-01',
               '2022-09-01', '2022-10-01', '2022-11-01', '2022-12-01',
               '2023-01-01', '2023-02-01', '2023-03-01', '2023-04-01',
               '2023-05-01', '2023-06-01', '2023-07-01', '2023-08-01',
               '2023-09-01'],
              dtype='datetime64[ns]', freq='MS')
시계열의 shift
1
2
3
4
5
6
7
8
np. random.seed(1)

arr = np.random.randn(12)

ts_idx = pd.date_range('2020-1-1', periods=12, freq='MS')

ts = pd.Series(arr, index=ts_idx)
print(ts)
1
2
3
4
5
6
7
8
9
10
11
12
13
2020-01-01    1.624345
2020-02-01   -0.611756
2020-03-01   -0.528172
2020-04-01   -1.072969
2020-05-01    0.865408
2020-06-01   -2.301539
2020-07-01    1.744812
2020-08-01   -0.761207
2020-09-01    0.319039
2020-10-01   -0.249370
2020-11-01    1.462108
2020-12-01   -2.060141
Freq: MS, dtype: float64
1
ts.shift(1)
1
2
3
4
5
6
7
8
9
10
11
12
13
2020-01-01         NaN
2020-02-01    1.624345
2020-03-01   -0.611756
2020-04-01   -0.528172
2020-05-01   -1.072969
2020-06-01    0.865408
2020-07-01   -2.301539
2020-08-01    1.744812
2020-09-01   -0.761207
2020-10-01    0.319039
2020-11-01   -0.249370
2020-12-01    1.462108
Freq: MS, dtype: float64
1
ts.shift(4)
1
2
3
4
5
6
7
8
9
10
11
12
13
2020-01-01         NaN
2020-02-01         NaN
2020-03-01         NaN
2020-04-01         NaN
2020-05-01    1.624345
2020-06-01   -0.611756
2020-07-01   -0.528172
2020-08-01   -1.072969
2020-09-01    0.865408
2020-10-01   -2.301539
2020-11-01    1.744812
2020-12-01   -0.761207
Freq: MS, dtype: float64
1
ts.shift(1, freq='W')
1
2
3
4
5
6
7
8
9
10
11
12
13
2020-01-05    1.624345
2020-02-02   -0.611756
2020-03-08   -0.528172
2020-04-05   -1.072969
2020-05-03    0.865408
2020-06-07   -2.301539
2020-07-05    1.744812
2020-08-02   -0.761207
2020-09-06    0.319039
2020-10-04   -0.249370
2020-11-08    1.462108
2020-12-06   -2.060141
dtype: float64
diff(n) : 행 - n 기간전 행
1
ts.diff(1)
1
2
3
4
5
6
7
8
9
10
11
12
13
2020-01-01         NaN
2020-02-01   -2.236102
2020-03-01    0.083585
2020-04-01   -0.544797
2020-05-01    1.938376
2020-06-01   -3.166946
2020-07-01    4.046350
2020-08-01   -2.506019
2020-09-01    1.080246
2020-10-01   -0.568409
2020-11-01    1.711478
2020-12-01   -3.522249
Freq: MS, dtype: float64
1
2
# 연산 방식
ts[1] - ts[0]
1
-2.236101777313317
1
ts.diff(3)
1
2
3
4
5
6
7
8
9
10
11
12
13
2020-01-01         NaN
2020-02-01         NaN
2020-03-01         NaN
2020-04-01   -2.697314
2020-05-01    1.477164
2020-06-01   -1.773367
2020-07-01    2.817780
2020-08-01   -1.626615
2020-09-01    2.620578
2020-10-01   -1.994182
2020-11-01    2.223315
2020-12-01   -2.379180
Freq: MS, dtype: float64
1
ts[3] - ts[0]
1
-2.697313985819412
resample
1
2
3
4
5
6
7
np.random.seed(1)

arr = np.random.randn(365)
time_idx = pd.date_range('2020-1-1', periods=365, freq='D')

ts = pd.Series(arr, index=time_idx)
print(ts)
1
2
3
4
5
6
7
8
9
10
11
12
2020-01-01    1.624345
2020-01-02   -0.611756
2020-01-03   -0.528172
2020-01-04   -1.072969
2020-01-05    0.865408
                ...
2020-12-26   -0.557495
2020-12-27    0.939169
2020-12-28   -1.943323
2020-12-29    0.352494
2020-12-30   -0.236437
Freq: D, Length: 365, dtype: float64
Down-Sampling
1
ts.resample('M').mean() # 일별 데이터를 월별로 변환
1
2
3
4
5
6
7
8
9
10
11
12
13
2020-01-31   -0.080317
2020-02-29    0.103058
2020-03-31    0.197086
2020-04-30   -0.077663
2020-05-31    0.105408
2020-06-30    0.175223
2020-07-31    0.161250
2020-08-31    0.025347
2020-09-30    0.176468
2020-10-31   -0.095381
2020-11-30    0.313264
2020-12-31   -0.364257
Freq: M, dtype: float64
Up-Sampling
1
2
3
4
5
arr = np.random.randn(10)
time_idx = pd.date_range('2020-1-1', periods=10, freq='W')

ts = pd.Series(arr, index=time_idx)
print(ts)
1
2
3
4
5
6
7
8
9
10
11
2020-01-05    0.727813
2020-01-12    0.515074
2020-01-19   -2.782534
2020-01-26    0.584647
2020-02-02    0.324274
2020-02-09    0.021863
2020-02-16   -0.468674
2020-02-23    0.853281
2020-03-01   -0.413029
2020-03-08    1.834718
Freq: W-SUN, dtype: float64
1
2
# forward filling 방식
ts.resample('D').ffill().head(21) # ffill : 각 기간의 첫일을 참고하여 결측값 보간
1
2
3
4
5
6
7
8
9
10
11
12
13
14
15
16
17
18
19
20
21
22
2020-01-05    0.727813
2020-01-06    0.727813
2020-01-07    0.727813
2020-01-08    0.727813
2020-01-09    0.727813
2020-01-10    0.727813
2020-01-11    0.727813
2020-01-12    0.515074
2020-01-13    0.515074
2020-01-14    0.515074
2020-01-15    0.515074
2020-01-16    0.515074
2020-01-17    0.515074
2020-01-18    0.515074
2020-01-19   -2.782534
2020-01-20   -2.782534
2020-01-21   -2.782534
2020-01-22   -2.782534
2020-01-23   -2.782534
2020-01-24   -2.782534
2020-01-25   -2.782534
Freq: D, dtype: float64
1
2
# backward filling : 각 기간의 마지막 날을 참고하여 결측값 보간
ts.resample('D').bfill().head(21)
1
2
3
4
5
6
7
8
9
10
11
12
13
14
15
16
17
18
19
20
21
22
2020-01-05    0.727813
2020-01-06    0.515074
2020-01-07    0.515074
2020-01-08    0.515074
2020-01-09    0.515074
2020-01-10    0.515074
2020-01-11    0.515074
2020-01-12    0.515074
2020-01-13   -2.782534
2020-01-14   -2.782534
2020-01-15   -2.782534
2020-01-16   -2.782534
2020-01-17   -2.782534
2020-01-18   -2.782534
2020-01-19   -2.782534
2020-01-20    0.584647
2020-01-21    0.584647
2020-01-22    0.584647
2020-01-23    0.584647
2020-01-24    0.584647
2020-01-25    0.584647
Freq: D, dtype: float64
시계열 데이터 시각화
1
2
3
import numpy as np
import pandas as pd
import matplotlib.pyplot as plt
1
2
3
4
5
6
7
np.random.seed(1)

ts_data = np.random.randn(365, 3) # (365 x 3) 행렬의 난수 데이터를 생성
ts_idx = pd.date_range(start='2021-01-01', periods=365, freq='D')

ts_df = pd.DataFrame(ts_data, index=ts_idx)
ts_df.head()
| 0 | 1 | 2 | |
|---|---|---|---|
| 2021-01-01 | 1.624345 | -0.611756 | -0.528172 |
| 2021-01-02 | -1.072969 | 0.865408 | -2.301539 |
| 2021-01-03 | 1.744812 | -0.761207 | 0.319039 |
| 2021-01-04 | -0.249370 | 1.462108 | -2.060141 |
| 2021-01-05 | -0.322417 | -0.384054 | 1.133769 |
1
2
ts_df.columns = ['X', 'Y', 'Z']
ts_df.head()
| X | Y | Z | |
|---|---|---|---|
| 2021-01-01 | 1.624345 | -0.611756 | -0.528172 |
| 2021-01-02 | -1.072969 | 0.865408 | -2.301539 |
| 2021-01-03 | 1.744812 | -0.761207 | 0.319039 |
| 2021-01-04 | -0.249370 | 1.462108 | -2.060141 |
| 2021-01-05 | -0.322417 | -0.384054 | 1.133769 |
1
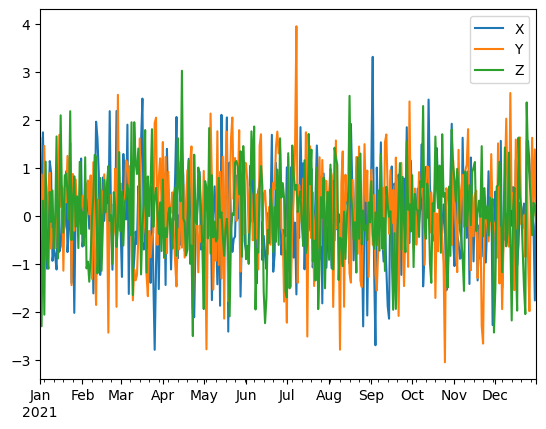
ts_df.plot()
1
<AxesSubplot:>
1
2
3
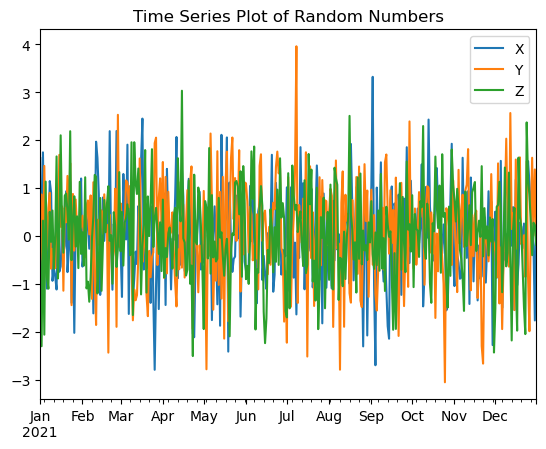
ts_df.plot()
plt.title('Time Series Plot of Random Numbers')
plt.show()
1
2
3
4
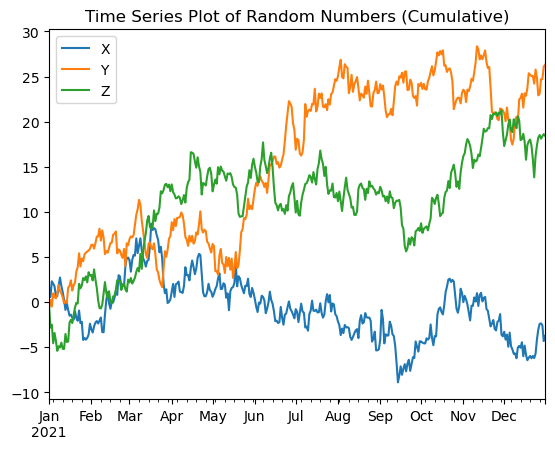
ts_df = ts_df.cumsum()
ts_df.plot()
plt.title('Time Series Plot of Random Numbers (Cumulative)')
plt.show()
1
2
3
4
5
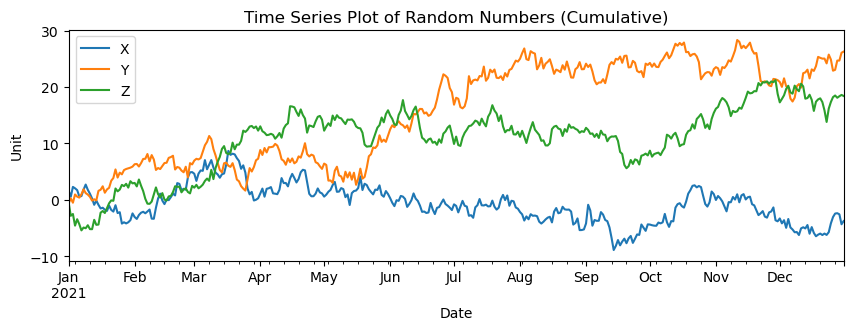
ts_df.plot(figsize=(10, 3))
plt.title('Time Series Plot of Random Numbers (Cumulative)')
plt.xlabel('Date')
plt.ylabel('Unit')
plt.show()
ice cream 데이터셋 로딩
1
2
ice_df = pd.read_csv('./data/ice_creamd.csv')
ice_df
1
ice_df.info()
1
ice_df.index
1
ice_df['year'] = ice_df['year'].astype(str)
1
2
ice_df['month'] = ice_df['month'].astype(str)
ice_df['date'] = ice_df['date'].astype(str)
1
ice_df.info()
1
2
date_str = ice_df['year'].values + '-' + ice_df['month'].values + '-' + ice_df['date'].values
date_str[:5]
1
2
ice_idx = pd.to_datetime(date_str)
print(ice_idx)
1
2
ice_df.index = ice_idx
display(ice_df)
1
2
ice_df.drop(['year', 'month', 'date'], axis=1, inplace=True)
display(ice_df)
1
ice_df.plot()
1
This post is licensed under CC BY 4.0 by the author.